Updated: Jun 22, 2022
I am a sucker for a cool data visualisation. However, last week, a friend, who works at Amazon, reminded me about the importance of plain numbers. Amazon famously despises PowerPoint presentations and prioritises written narratives in their communications and I love it. Also, I’ll do anything not to make a useless PowerPoint presentation again.
To prioritise plain numbers and narratives in reporting, you may have to use more tables. So, let me show you how to present attractive tables.
This week’s video actually aligns with this post 😅
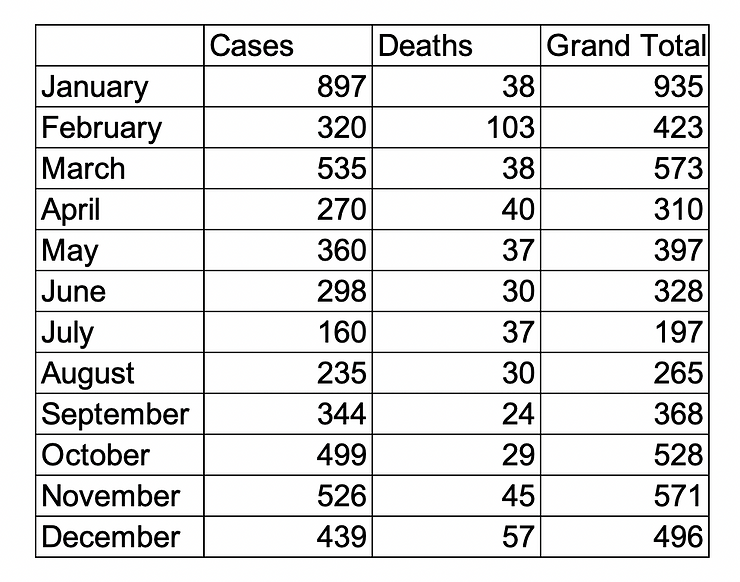
We want to spice the table up and present it in a report. There are several storytelling guidelines to consider here, such as target audience, but I don’t want to get into that now. For this exercise, we will assume the audience is interested in the trend in cases and deaths in the calendar year, and they want to see the data in a table.
Disclaimer: My prescriptions are subjective, so follow along if you dare
To show the trend in the cases and deaths in the calendar year, I start by changing the orientation of the table by copying the table, right-clicking, and pasting it in transpose
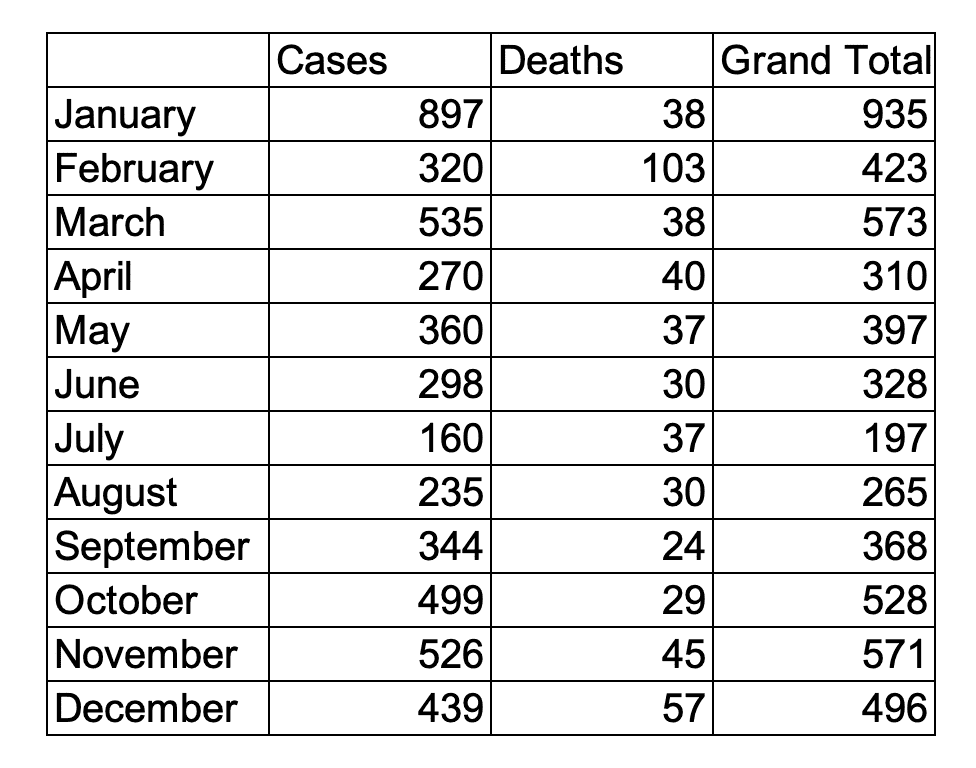
Our new table looks like this ⬇️. In this format, we can see the trends better.

Format your tables with these rules (remember my disclaimer about subjectivity and drink this KoolAid)
Following the rules above, our table should look like this now ⬇️

We declutter so we can focus attention on specific aspects of the data. I learned a great technique from Storytelling with data about focusing attention: starting with grey! Grey everything out and then start intentionally deciding which features should stand out.
I select the entire table and make all borders and text grey

The difference is subtle
I add 2 extra columns for Trend and Grand total

To learn how to insert the sparklines in the Trend column, watch the video below ⬇️. Do not worry, I have it starting at the exact point you need 😉 (if not, skip to 04:31🙏🏾)
I remove all the borders (patience pays 😅)

We only want to add additional ink where it is necessary. I add a border to separate the months from the rest of the data. We are almost there 😍

Because I am interested in the trend of cases and deaths in the calendar year, I bold Cases, Deaths, and their totals.

We are done!
Let’s compare the 2 tables now. Which do you prefer?

You will have to present your data in a tabular form at some point in your career. Make it look good.
Have a great week!