Hi! I am here to save your time. We have all had to create a graph/chart at some point, right? If not, you’re lucky and I want your life? I think? Irregardless, (because I have chosen violence and pretentiousness today) I am going to show you the fastest way to create a chart in Excel. It takes less than 30 seconds and you have already wasted 10 seconds reading this, so let’s go!
This week’s video:
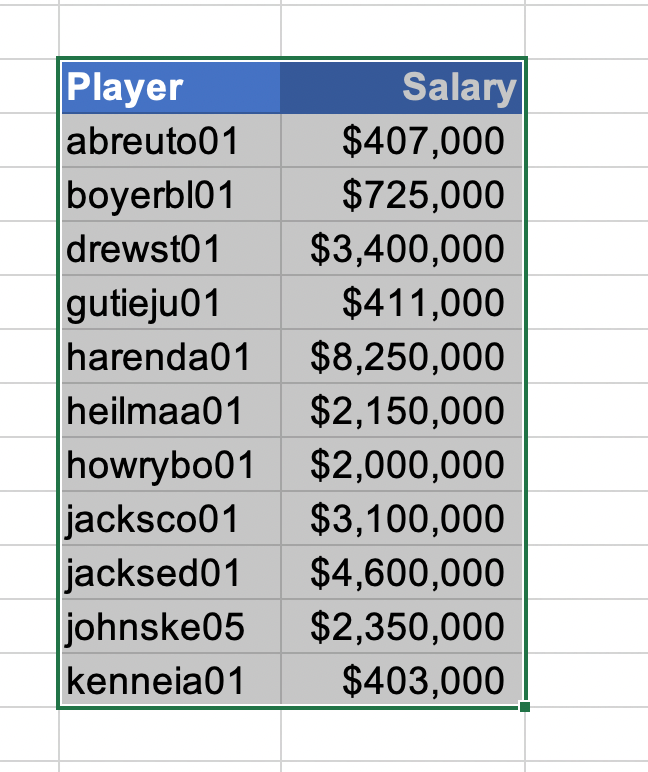
On a PC, press Alt, Fn, and F1. For some of you, it might be Alt + [Windows Button] + F1. On a Mac, use Option (⌥), Fn and F1.
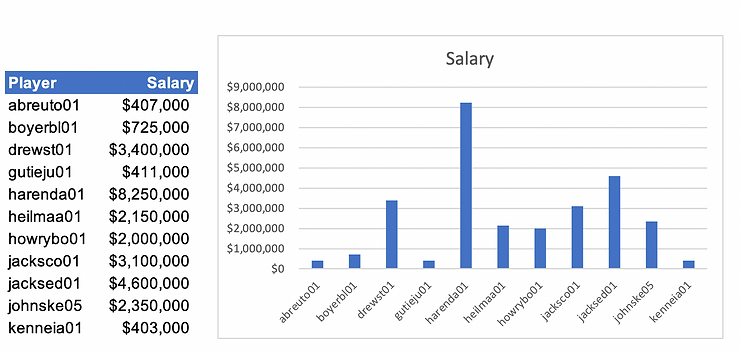
This should create a chart instantly.
Bonus points if you can make your chart look cuter and share it with me
That’s it!
Charts are useful for visual learners and processors to get a better picture of what they are dealing with. Use charts often in lieu (I’m on a roll, today!) of text or tables.
Have a good week!